GLIDER software resources
GLIDER links:
- Back to GLIDER homepage
- Software information (design, features, etc. -- you are here)
- Download GLIDER
- Known issues
- Sample files
- Tutorial videos and workshop
On this page you will find more in-depth information about the GLIDER software as well as tutorials and sample data to help you start using the program right away for your own projects:
- GLIDER Design
- GLIDER Features
- GLIDER Views
- Satellite Image Calibration
- Image Display and Analysis
- Image Processing
- Unsupervised Classification
- Tutorials and Download
- Sample Data
- Known Issues
Open architecture is a relatively novel approach to software reuse in which independent third-party developers may introduce new functional modules, replace or remove existing modules, or alter module bindings or interrelationships. This approach is an improvement over other customization techniques, which may permit third parties to extend applications but restrict replacement or removal of functional modules, either explicitly or because of tight coupling among the existing modules. An open architecture development model insures that the base platform is capable of supporting third-party extensions, often at multiple levels of abstraction, and that changes in the base platform can be made without breaking the community-developed plug-ins.
The Eclipse Rich Client Platform (RCP) is one such open architecture effort that supports thousands of community-contributed plug-ins, making it a popular development platform for many diverse applications [11], including the Science Activity Planner developed at JPL for the Mars rovers. Eclipse is an implementation of the OSGi (formerly Open Services Gateway initiative) framework for defining, composing, and executing components and plug-ins. The OSGi Alliance is a worldwide consortium of technology innovators that advances a proven and mature process to assure interoperability of applications and services based on its component integration platform. The Eclipse RCP can be used to build a variety of user applications that support a high-quality end user experience for a particular domain. The UIs support common desktop motifs such as drag and drop, system clipboard, navigation and customization. GLIDER, based on the Eclipse RCP, is designed and built as an open, extensible data environment that can be customized easily via “plug-ins” to a build rich client tool.
A rich client platform is typically used as a building block to create a client for a backend service such that the client delivers a rich user experience. It is platform independent, so that clients based on the RCP can run with little or no modifications on multiple platforms and devices. An RCP has a robust component model that is extensible, allowing it to be easily customized. It also typically has an integrated update mechanism.
Why base GLIDER on Eclipse RCP?
The Eclipse RCP was considered as the basis for building GLIDER because of its many advantages, particularly reusability. The notion of reusability is not just limited to class reusability, but full component or module reuse. Such reuse typically is not easy to achieve but Eclipse's architecture makes this much more possible than other platforms. The Eclipse RCP also serves as a generic extensible scalable GUI client that makes possible extremely rapid development. It provides a set of generic components that can be customized for specific applications. These components manage the GUI layout including layouts, sizing and allowing users to configure layouts using perspectives. RCP promotes code reuse for commonly used features such as commands, menus and command handlers. It allows client applications to be branded using a customized splash screen, introduction screens, icons and buttons. Thus, the final product looks and feels distinctly unique. Finally, the Eclipse RCP has a large user community that has already created a large suite of existing plug-ins. This allows us to leverage existing plug-ins and build on existing third party functionality for GLIDER.
There are also disadvantages of using the Eclipse RCP. For starters, there is a step learning curve, and it may be hard to figure out and manage dependencies between plug-ins. The GUI widgets in the Eclipse RCP are based on SWT and JFace, causing compatibility issues when reusing code with Swing components. These issues had to be resolved during the GLIDER development.
The GLIDER architecture is shown below. The Eclipse workbench, which allows plug-ins for user interface, has been extended via three custom plug-ins. The Image View plug-in is based on IVICS and provides the user the capability to visualize the satellite imagery in its native swath view. The Earth View plug-in uses the World Wind SDK and is used to display the satellite image on a 3D globe. The Plots plug-in uses the JFree Charts java library to create custom plots for analysis. These plots include scatter plots, histogram, spectral profile etc.
 All the ADaM modules are being added as plug-ins to the Eclipse platform. These algorithms have been categorized into three groups based on their function and the data model on which they operate. All the image processing plug-ins operate on a simple binary image format. The ARFF data format, which holds the feature vector data, is used by all the pattern recognition plug-ins. The utility plug-ins support both the image processing and the pattern recognition capabilities within GLIDER. The key component within GLIDER is the set of data translation operations. These operations, also added as plug-ins, provide the glue between the different visualization and analysis plug-ins. These operations include modules to read and calibrate MODIS L1 data in HDF-EOS data format.
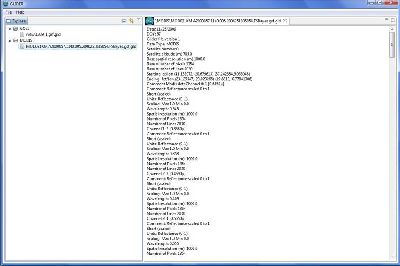
GLIDER provides users three views to manage, visualize and analyze data. In the Project Explorer View shown below, users can create projects to organize their data and analysis results. If a particular data set is selected within this view, its metadata is displayed on the right panel. This allows the user to browse useful metadata information such as the different fields contained within the data, its spatial bounds and the temporal range. Once the user has selected a file within the Project Explorer, a menu is presented, allowing the user to either view the data in the Image Analysis View or the Earth View.
Using the Image Analysis View shown below, the user can visualize the entire satellite swath. This View provides powerful image analysis capabilities designed to enable interactive data exploration. A user can open multiple Image Analysis Views to visualize different data files at the same time.
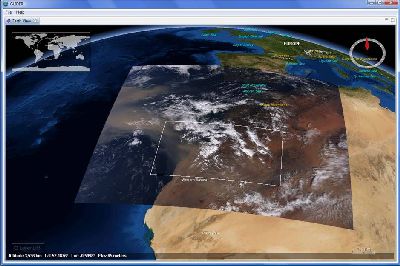
From either the Project Explorer or the Image Analysis View, the user can open the Earth View to visualize the data projected on a 3D globe. The Earth View, shown below, uses the navigation information to display the satellite imagery in the geographic coordinate system using the WGS84 datum. The Earth View is dynamically synced with the Image Analysis View. Any changes made to the display in the Image Analysis View automatically cause the Earth View image to refresh. Thus, a user can change spectral bands in the Image Analysis View and the image projected on the globe will automatically change. The results of image processing and pattern recognition operations can also be visualized in this view. Moreover, the user can display images from multiple Image Analysis Views on the same globe. Additional ancillary data such as cities, political boundaries can be added to the display within the Earth View.

GLIDER has image calibration routines built into it’s data readers. For example, while the MODIS data is read by the tool, it is calibrated into reflectance and brightness temperature based on the actual radiance values. The release version 1.0 can read and calibrate MODIS satellite imagery. Other satellite data will sets be added in the future releases.
GLIDER provides many different image display functionality in both Image View and the Earth View. Within the Image View, the user can view the satellite data as a grey scale or create a three channel color composite using different spectral bands. There are features such as linear contrast stretch, grey scale inversion and histogram equalization that can be applied to enhance the image. Pan and scroll capabilities are also available within Image View. The Earth View allows the user to display the satellite imagery on a 3D globe and be able to zoom, pan and rotate in 3D. A user can display multiple images on the globe as layers and select or deselect different layers. The Earth View also allows overlay of vector and model data in 3D.
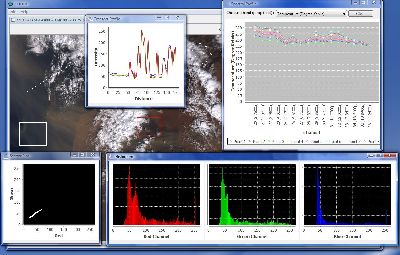
There are several image analysis features that are currently available in GLIDER. Histogram analysis feature allow users to create a histogram of the three selected spectral bands based on a user selected region or part of the image that is visible or the entire image. User can also create scatter plots between two spectral bands. The scatter plots are displayed using pixels from either user selected region or part of the image that is visible or the entire image. GLIDER also provides the capability to analyze spectral profiles of individual pixels. This feature is extremely useful in determining which spectral bands provide the maximum separation for different classes while performing supervised classification. Spectral profiles of multiple pixel points can be generated on a single plot. Linear transect feature allows the user to arbitrarily draw a line anywhere on the image. The spectral values of all the pixels coincident with this line channel being displayed are presented as a line plot. Examples of the different image analysis features are shown below.
GLIDER also provides a set of image processing capabilities that are useful for extracting features from images as a precursor to mining. Since, filtering plays an important role in many image analysis applications, GLIDER contains spatial domain, median, mode and morphological filtering (erosion and dilation) capability. It also includes the pulse coupled neural network, which can be used for image smoothing and segmentation. GLIDER can be used to find boundaries, contiguous regions, and polygons in images.
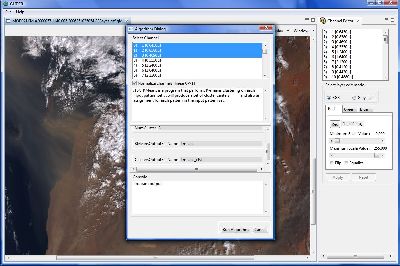
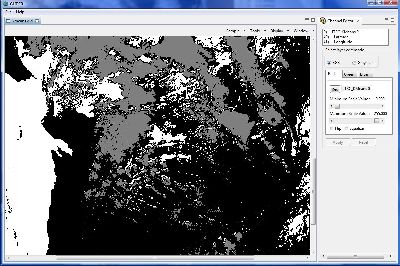
GLIDER provides users the capability to perform unsupervised classification or clustering using the spectral bands as features. There are several different clustering algorithms available within glider and these are Isodata, Maximin, Hiearchical, Kmeans and Kmediods. All of these clustering algorithms take a set of patterns such as values at different spectral bands as input and group them into classes based on some similarity measure. The use of K-Means clustering algorithm, including parameter specification, is depicted below.
You may download the GLIDER software here.
Also available are written and video GLIDER tutorials, as presented by Dr. Rahul Ramachandran for a workshop at NTU and NCU, Taiwan, 2010.
Sample data
We have placed some sample data online for you to use with GLIDER in order to help you learn the software with more ease.
Known Issues
Provides you with a list of known issues with the GLIDER software.